Plot results of mlts
Usage
mlts_plot(
  fit,
  type = c("fe", "re", "re.cor", "int"),
  bpe = c("median", "mean"),
  what = c("all", "Fixed effect", "Random effect SD", "RE correlation",
    "Outcome prediction", "RE prediction", "Item intercepts", "Loading",
    "Measurement Error SD"),
  sort_est = NULL,
  xlab = NULL,
  ylab = NULL,
  facet_ncol = 1,
  dot_size = 1,
  dot_color = "black",
  dot_shape = 1,
  errorbar_color = "black",
  errorbar_width = 0.3,
  add_true = FALSE,
  true_color = "red",
  true_shape = 22,
  true_size = 1,
  hide_xaxis_text = TRUE,
  par_labels = NULL,
  labels_as_expressions = FALSE
)
Arguments
- fit
An object of class
mlts.fit- type
Type of plot. type = "fe" (Default) Forest-plot of model coefficients. type = "re" Plot of individual (random) effects type = "int" Experimental: Plot within-level interactions. type = "re.cor" Combined plot depicting the distribution of individual parameter estimates (posterior summary statistics as provided by
bpe), as well as bivariate scatter plots.- bpe
The Bayesian point estimate is, by default, the median of the posterior distribution (
bpe = "median"). Setbpe = "mean"to use the mean of the posterior distribution as point estimates.- what
Character. For
type = "fe", indicate which parameters should be included in the plot by settingwhatto "all" (the default), or one (or multiple) of "Fixed effect", "Random effect SD", "RE correlation", "Outcome prediction", "RE prediction", "Item intercepts", "Loading", or "Measurement Error SD".- sort_est
Add parameter label for sorting of random effects.
- xlab
Title for the x axis.
- ylab
Title for the y axis.
- facet_ncol
Number of facet columns (see
ggplot2::facet_grid).- dot_size
numeric, size of the dots that indicate the point estimates.
- dot_color
character. indicating the color of the point estimates.
- dot_shape
numeric. shape of the dots that indicate the point estimates.
- errorbar_color
character. Color of error bars.
- errorbar_width
integer. Width of error bars.
- add_true
logical. If model was fitted with simulated data using
mlts_sim, true population parameter values can be plotted as reference by setting the argument otTRUE.- true_color
character. Color of points depicting true population parameter used in the data generation.
- true_shape
integer. Shape of points depicting true population parameter used in the data generation.
- true_size
integer. Size of points depicting true population parameter used in the data generation.
- hide_xaxis_text
logical. Hide x-axis text if set to
TRUE.- par_labels
character vector. User-specified labels for random effect parameters can be specified.
- labels_as_expressions
logical. Should parameter names on plot labels be printed as mathematical expressions? Defaults to
FALSE. Still experimental.
Examples
# \donttest{
# build simple vector-autoregressive mlts model for two time-series variables
var_model <- mlts_model(q = 2)
# fit model with (artificial) dataset ts_data
fit <- mlts_fit(
model = var_model,
data = ts_data,
ts = c("Y1", "Y2"), # time-series variables
id = "ID", # identifier variable
time = "time",
tinterval = 1 # interval for approximation of continuous-time dynamic model,
)
#> Time series variables as indicated by parameter subscripts:
#> 1 --> Y1
#> 2 --> Y2
#>
#> Note that obtaining (standardized) estimates by cluster,
#> requires settting `monitor_person_pars = TRUE`. However, keeping the default option
#> (`monitor_person_pars = FALSE`) can improve sampling times.
#> Warning: There were 1 divergent transitions after warmup. See
#> https://mc-stan.org/misc/warnings.html#divergent-transitions-after-warmup
#> to find out why this is a problem and how to eliminate them.
#> Warning: There were 1 chains where the estimated Bayesian Fraction of Missing Information was low. See
#> https://mc-stan.org/misc/warnings.html#bfmi-low
#> Warning: Examine the pairs() plot to diagnose sampling problems
#> Warning: The largest R-hat is NA, indicating chains have not mixed.
#> Running the chains for more iterations may help. See
#> https://mc-stan.org/misc/warnings.html#r-hat
#> Warning: Bulk Effective Samples Size (ESS) is too low, indicating posterior means and medians may be unreliable.
#> Running the chains for more iterations may help. See
#> https://mc-stan.org/misc/warnings.html#bulk-ess
#> Warning: Tail Effective Samples Size (ESS) is too low, indicating posterior variances and tail quantiles may be unreliable.
#> Running the chains for more iterations may help. See
#> https://mc-stan.org/misc/warnings.html#tail-ess
# inspect model summary
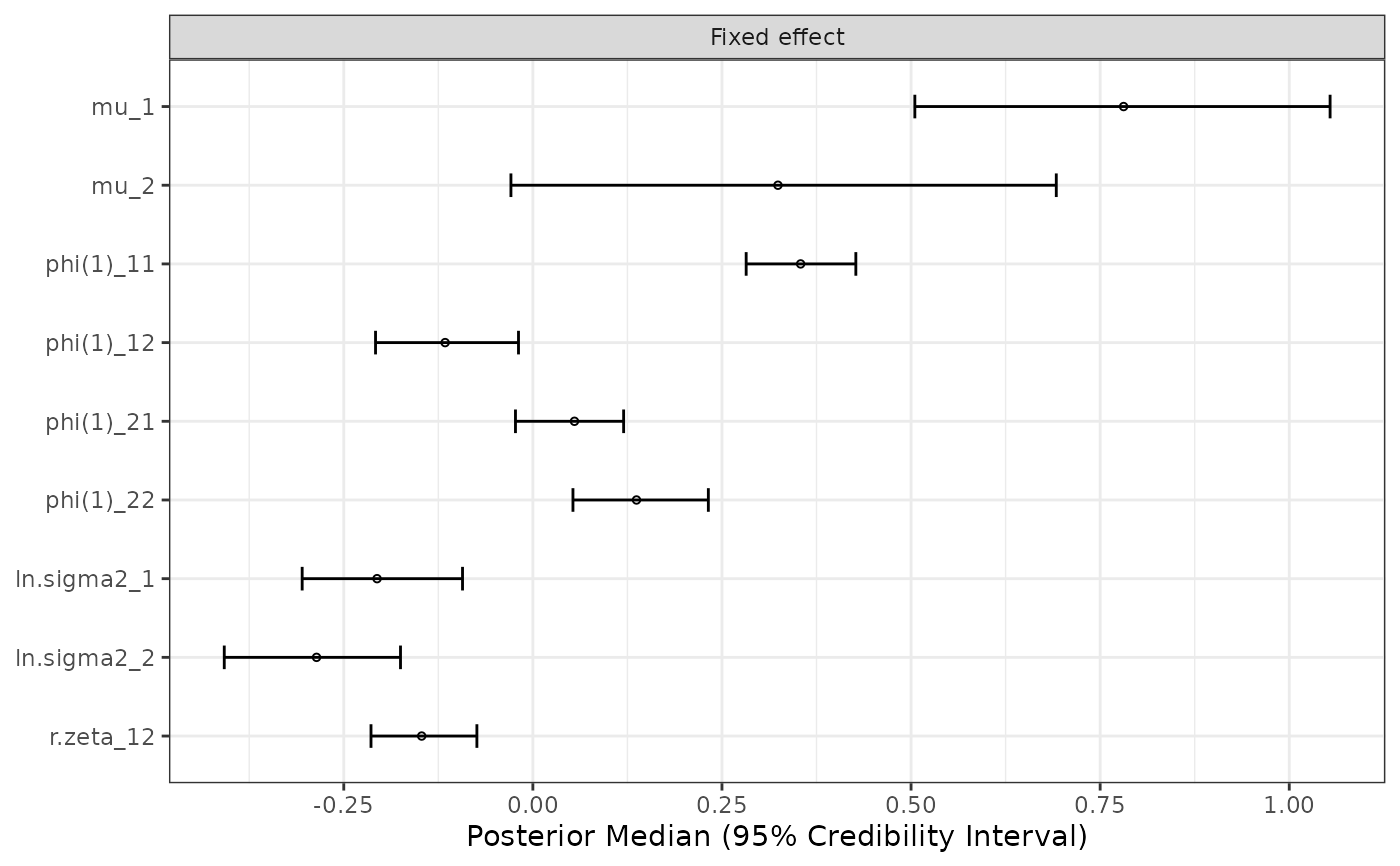
mlts_plot(fit, type = "fe", what = "Fixed effect")
 # }
# }